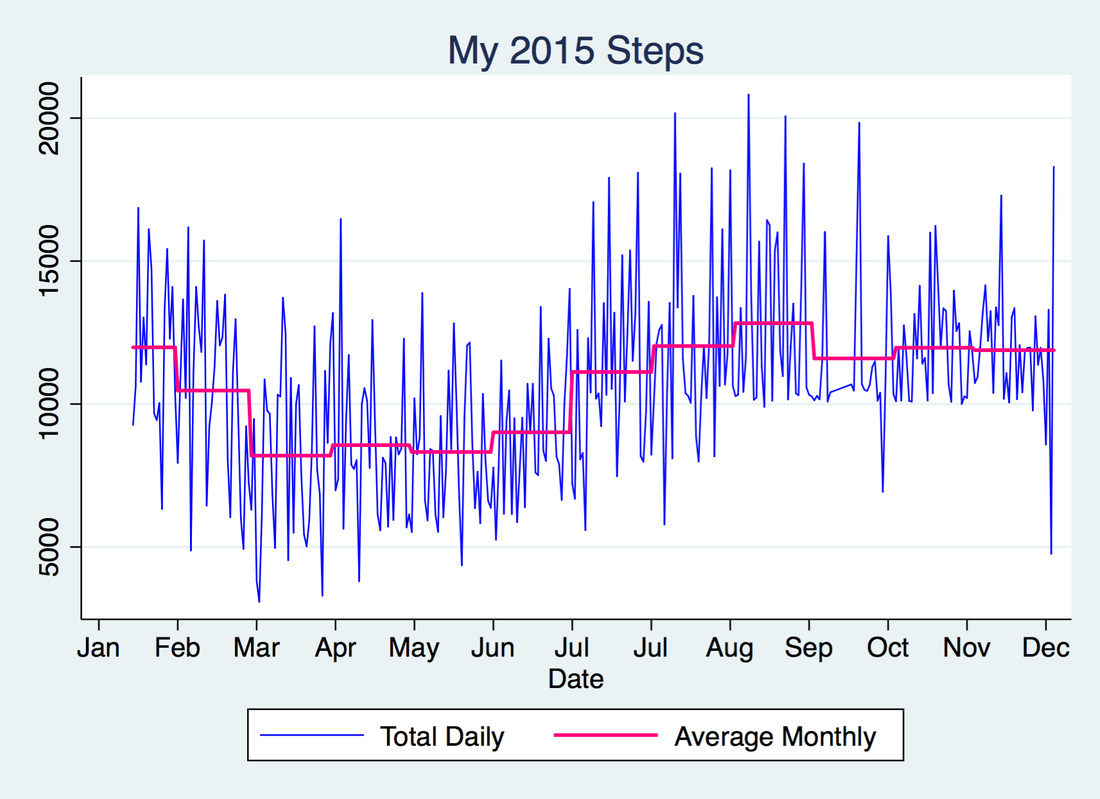
I got my Fitbit on January 15, 2015 and I have been obsessed with it ever since (sorry not sorry, friends and family). I figured that now that 2015 is over, I'd look at my step trends for the year. The graph above shows my total daily steps in blue and my average monthly steps in pink. As you can see, my average daily steps went up after July and remained above 10k throughout the end of the year.
I wasn't meeting goal very often before July and this is evidenced in the graph below. It counts how many times I missed my step goal for every month in 2015: 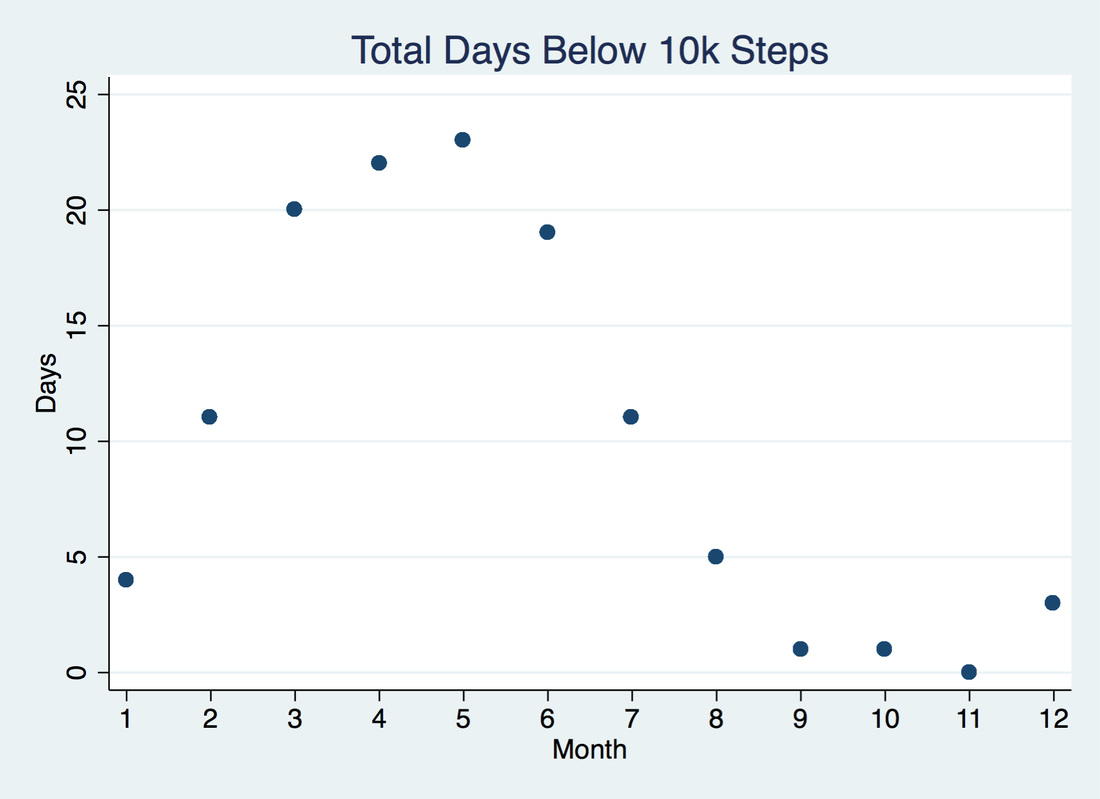
I got better at meeting goal and became more competitive as more people I knew (like Will) got Fitbits and challenged me with Fitbit's Goal Day, Weekend Warrior, Daily Showdown and Workweek Hustle challenges.
Using Stata and Google Charts API I made the following graphic which shows my steps above or below my goal of 10k.
This was motivated by my Fitbit & Google Calendar Chart blog post. The legend is similar:
This includes a total of 344 days. My average daily steps for 2015 was 10,593 steps, and for the months of July through December was 11,910. Also, as the Stata graphs above illustrate, the months of February through June show a lot of days where I missed my step goal. For 2016, I'm aiming to have a lot more blue cells with darker shades of blue. That's my resolution :)
6 Comments
Amabile Dario
9/13/2016 09:56:36 pm
It is awesome, congrats I wanna do the same!
SomeDude
9/14/2016 10:19:13 am
Can you post the do file contents?
Vahe Heboyan
9/14/2016 12:09:05 pm
Thanks for the post. Can you share Stata code with us?
Xiaodong Cai
9/15/2016 10:21:04 am
Cool. Thanks for sharing! Could you post some "sample" command lines that produced the Calendar Chart?
Richard Hofstetter
9/16/2016 12:18:05 pm
Would you please sent exactly how you downloaded steps from fitbit and the STATA syntax you used for the processing through graffing?
David Borth
1/23/2017 04:40:14 am
I am also interested. In how to download steps and other data from fitbit. Your comment will be posted after it is approved.
Leave a Reply. |
