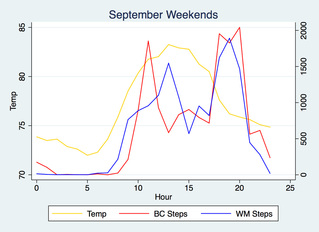
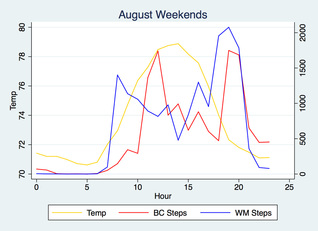
You know how when you have nothing in particular to talk about, you start talking about the weather? Well, let's talk about the weather. September was a really hot month. Well, at least in San Diego. The average temperature recorded at Miramar (KNKX) was 76.3 with a minimum of 66 and a maximum of 94. Compare this to a mean of 73.7, a minimum of 60 and a maximum of 90 in August. For this blog post I wanted to see how my steps looked like alongside the average hourly weather for September. Above, you'll see the hourly weather (in yellow) compared to my average hourly steps (in red) alongside my coworker Will's hourly steps (in blue). During the weekends in September I was more active as the day progressed and the weather got cooler. I took a few long runs or walks in August and September during Saturday/Sunday mornings which explains the spikes before noon. Overall, however, there was less activity during the hotter parts of the day in September than in August, which is to be expected. Nobody wants to be out running when it's hot and humid. Not a lot of surprising data, but it's nice to visualize it here. 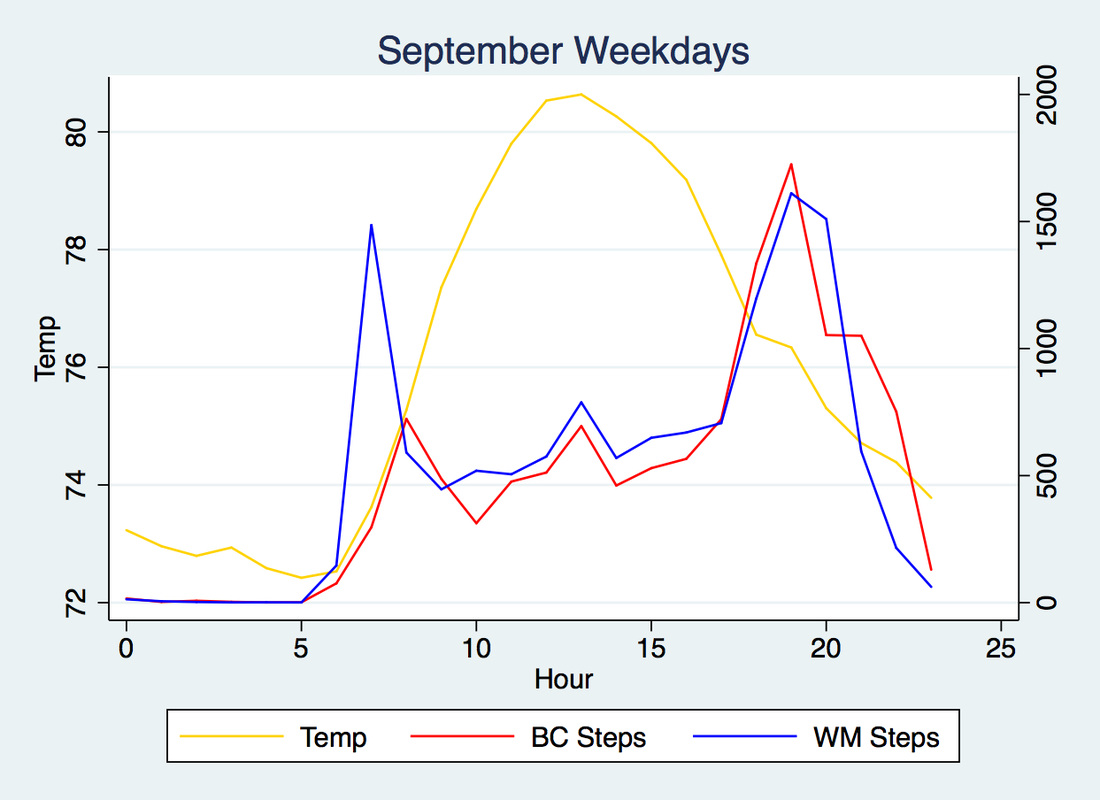 During weekdays, I'm at the office and so there's not a lot of step activity while I'm at work. Recall last month's post regarding my hourly step comparison with my coworker Will. Our steps during the work hours (8 AM - 6 PM) is correlated at 0.93 (our weekend steps were a little correlated at 0.85) in the month of September. A bit higher than last month's 0.89.
I'd be interested to see how correlated my steps are with other people who have a Fitbit at the office, but I have a suspicion it's probably the same as ours. Walks happen during the earlier part of the day, during lunch time, and then going back to the car after work. Thankfully, I didn't suffer too much during last month's heat wave as I was at the office during those hours. Stay tuned for next month's monthly comparison. My plan is to see how Fitbit challenges, like the Weekend Warrior, look on an hourly basis. I hypothesize there are many lags as competitors are driven to beat each other's steps.
0 Comments
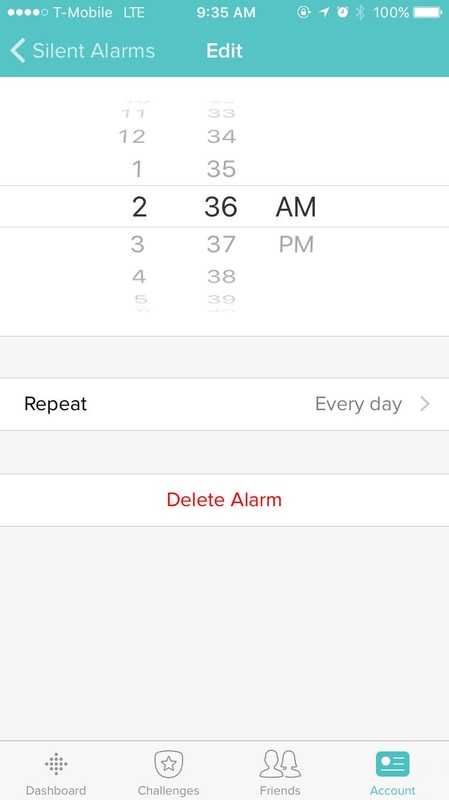
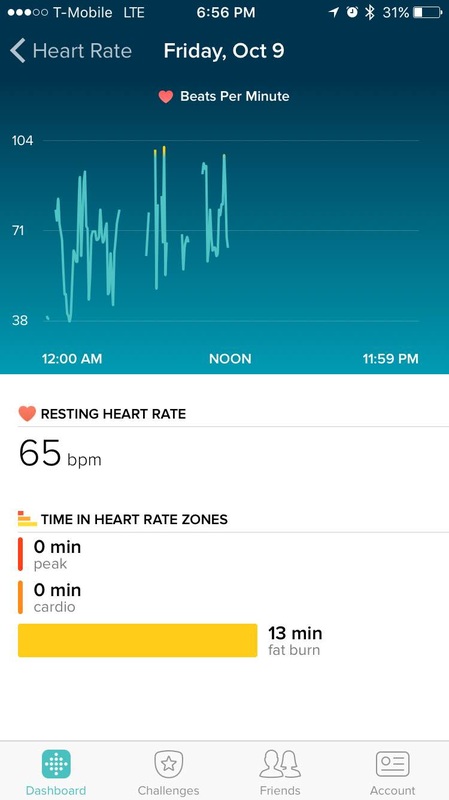
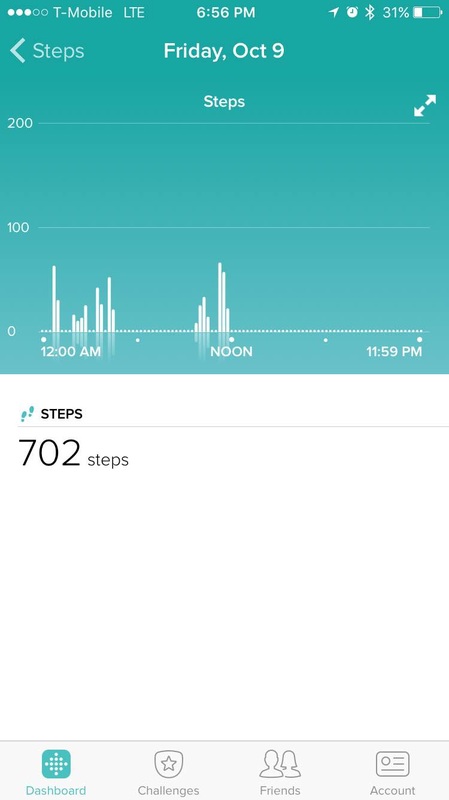
Day 0 Thursday, October 8 Time: 7:10 PM I'm at the gym, class is ending, and as I look over at the front desk area I see my Fitbit sitting on the counter. I think to myself, "don't forget to grab it before you leave." I talk to a few people after class, go to the ladies locker room and upon my return I see that my Fitbit is no longer on the desk. I get a sinking feeling. My heart rate goes up, and my Fitbit isn't on my wrist to tell me so. I look around and I ask the front desk person if she's seen it. She tells me that she never saw it there and asks people around. The children playing around the front desk area admit that they played with it and then claim they set it down after picking it up. The gym staff and I look on the floor, around lockers and everywhere else trying to figure out where it might have gone. I open up the Fitbit app on my phone and I click on "sync now" trying to locate it as my first thought was that a kid probably stashed it away in some remote part of the gym while playing with it and was too embarrassed to confess after the fact. No luck. I do notice, however, that there are three cameras pointing at the front desk, so I ask them if they can see who might have grabbed it. They tell me they'll look into it. I leave sad and instantly feel naked without my Fitbit. Time: 9:50 PM I log into the Fitbit app on my phone (old habits die hard) and I see that my Fitbit synced at 8:51 PM. WHAT? HOW?! I go to Fitbit's website and it says "If it synced recently, that means it is within 15-20 feet of a computer with the Fitbit Connect software installed and a dongle plugged in. " This assures me that someone at the gym walked out of it with it. I immediately email Fitbit's support account and let them know what happened. After finding out that my Fitbit is syncing, I decided to find out more about my thief. So I keep checking the app because, clearly, this person lives in a house where there's a Fitbit dongle. 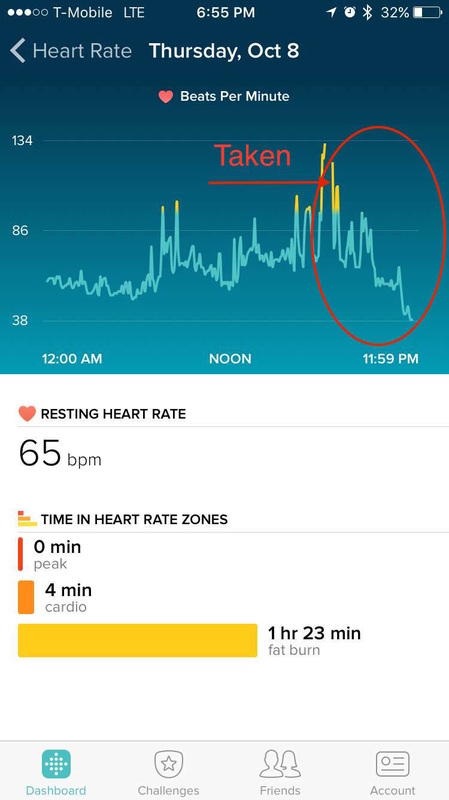 Day 1 Friday, October 9 A full 24 hours have passed. The cameras at the gym still hadn't been reviewed, so I check on the Fitbit and I see its "Last Sync" change to recent times, so I decide to add some alarms to annoy the thief. Did you know that you can only have up to 8 alarms on your Fitbit? I sure didn't. Thanks, thief. I added a few alarms set to go off before dawn to teach the thief a lesson: don't mess with me or my Fitbit...
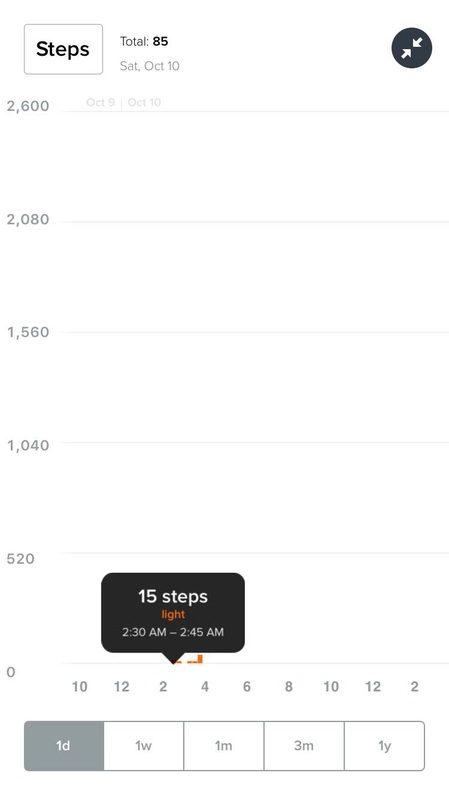
Sure enough, the 2:36 AM alarm made this person get up as they seemed to have taken a few steps. It looks like the other alarms went off, too, and disturbed this person's sleep. Mission accomplished! I kept checking the app and what do you know? More heart rate data, but very few steps. This person seemed to be wearing it intermittently.
Day 2
Saturday, October 9 I get a phone call from the gym telling me that they've found a Fitbit and that might belong to me. I go check it out, and lo and behold, there it is. It works fine and it synced right away. The only thing is that it smells of Chanel No. 5 (yuck) and it irks me that someone else was wearing it. The gym had told me that they couldn't check the camera feed without the I.T. guy, who apparently doesn't live in the area, yet had assured me that if they couldn't find it by Sunday they'd buy me a new one. Well, that's nice. At the end of the day, I did get my Fitbit back, but part of me wants a new one after seeing all this activity. Wouldn't you? Oh well. Little Fitbit of mine, where you were, we'll never know. 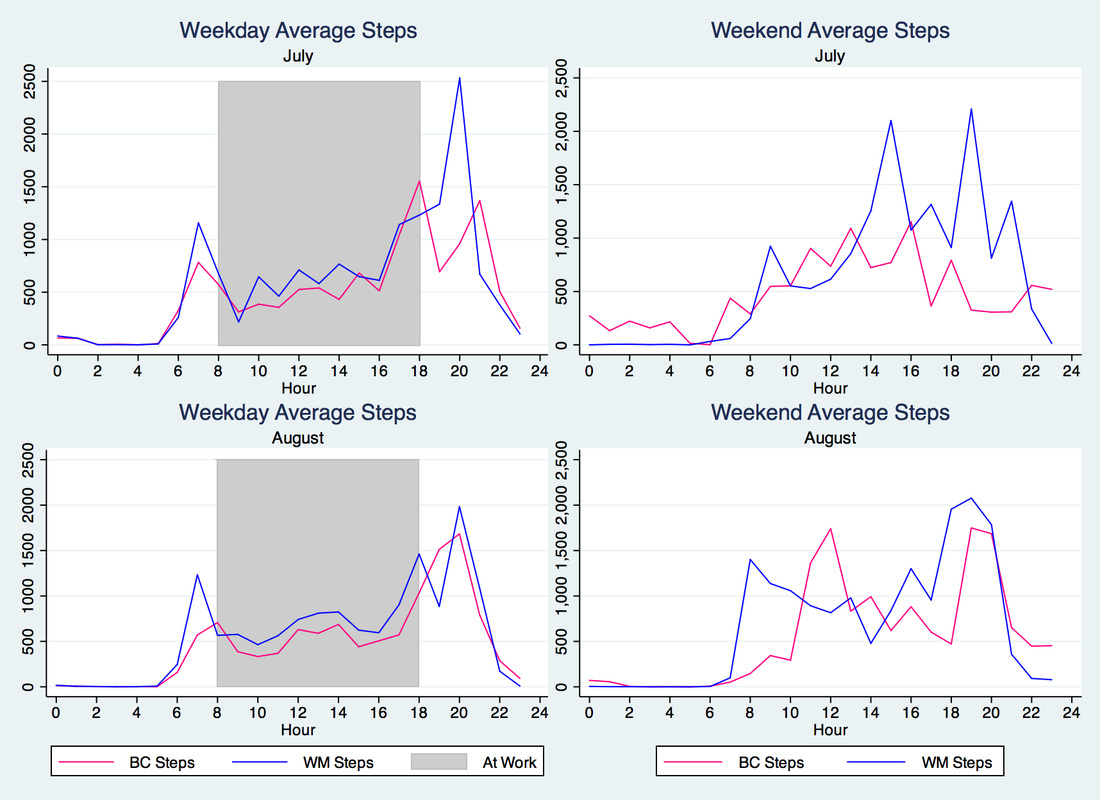 A fellow coworker of mine gave me his hourly Fitbit steps data to analyze in combination with my data to see if there are any similarities or patterns that emerge. Above, I've summarized the average steps taken hourly for both of us by weekday or weekend for the months of July and August. Note: He purchased his Fitbit in July, so there are a few days that are missing, but he more than made up for that by logging crazy amounts of steps (he got to 25,000 steps in one day -- a Fitbit "badge" I've yet to earn!). So, what does this data tell us? During weekdays of July and August:
So why did I do this? Well, at work, the both of us constantly check our Fitbits and compare whose got the most steps. It kind of drives everyone who doesn't have a Fitbit a little insane (and maybe even those who have Fitbits, but aren't obsessed). Friendly, and better yet, healthy rivalries never hurt anybody, right? For more details, I've included a snapshot below of the last full week of August. You can see we have very similar weekdays and sometimes I'm even winning in terms of step count :) 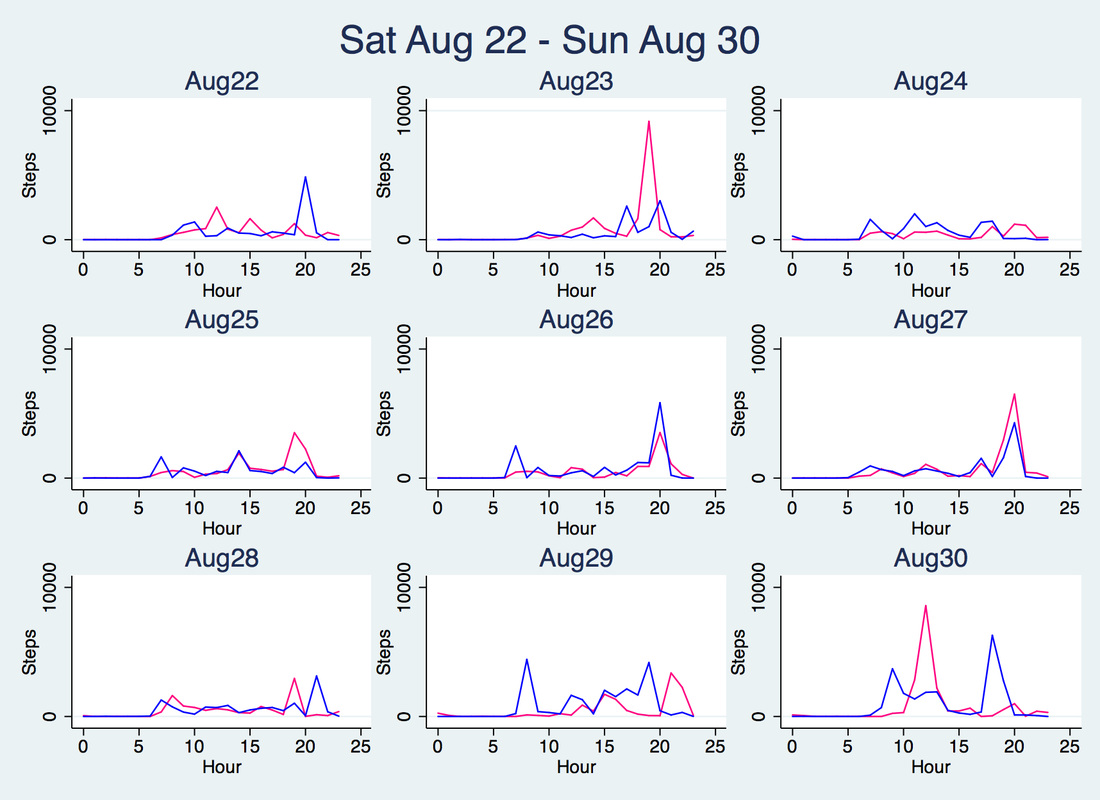 Hoping that my September step count looks a lot better than WM's or my previous month's step count, for that matter. It better be! I just signed up for my first half marathon!
Thanks to my Fitbit Charge HR, I have been tracking my activities, such as running, walking, and Barre3. Logged activities on Fitbit include a summary of calories burned, minutes spent in different heart rate zones, total time of activity, and steps taken. I wanted to see if different instructors were having a different effect on my workouts since I sometimes left a hot mess and other times not so much after leaving Barre3. So, I started tracking activities and have a total of 94 classes in a sample that I've analyzed to figure out which instructors pushed me the most. Below, I’ve plotted the average number of minutes spent in each heart rate zone from fat burn, cardio, to peak zone along with my instructors .
Not only did this visualization help me figure out which instructors were pushing me the most it also helped me realize that I was spending less than 15 minutes in the cardio zone (on average) doing the online workouts! I guess the class atmosphere is more effective (plus, sometimes Hayek would interrupt my workouts - he really likes my yoga mat). As you can see, Jenn, Kate and Lauren helped me spend more time in the peak heart rate zone, so their classes were the ones I liked to attend the most. I originally made a dashboard on Tableau by downloading my activity data on Fitbit, cleaning up the data using Stata, saving it as a .CSV file and then playing with different visualizations on Tableau Public. I originally also posted the Tableau chart here, however, when displaying it on my blog it didn't seem to be mobile friendly so I used Google Charts API instead. It ended up being a win-win: I learned something new and now mobile readers will have an easier time scrolling through the chart. 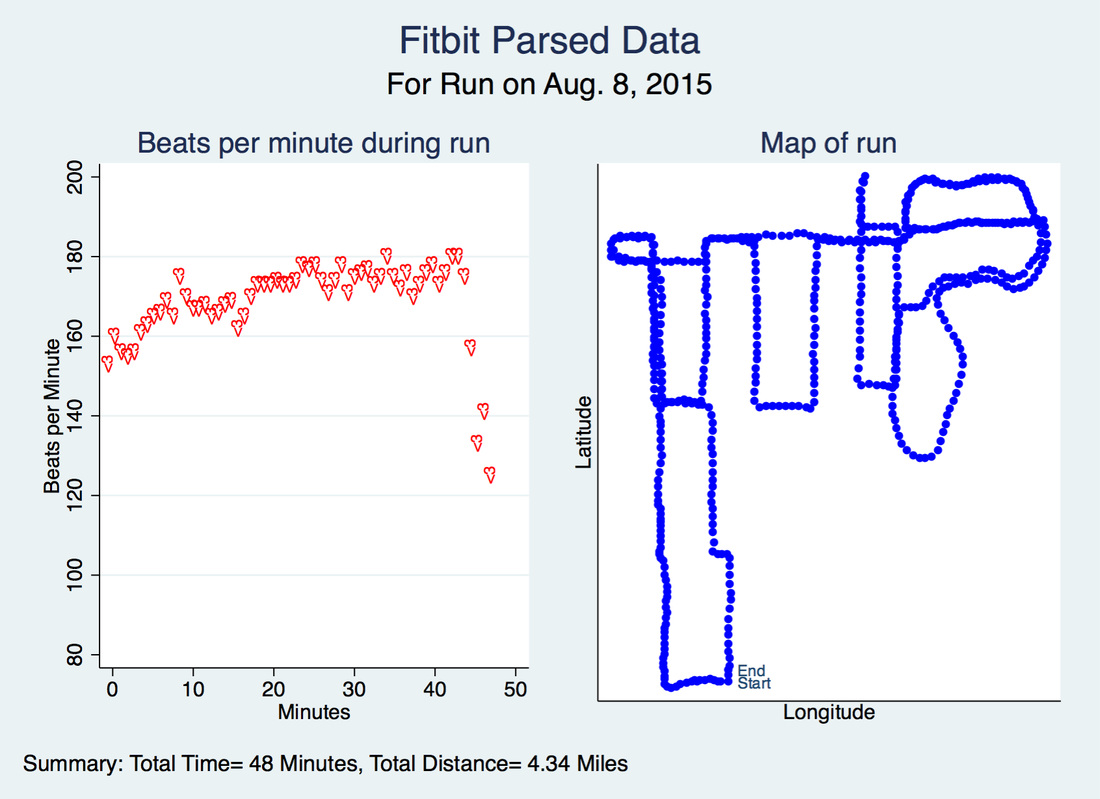
My data is from Fitbit.com. Graphs were made using Stata 12/IC.
Recently, I learned how to parse data on Fitbit.com by going to the Log -> Activities page and looking at individual activities such as walks or runs in Stata. By viewing the page source information and saving it as an .html file, I am able to parse out what data my fitbit collects during an activity such as: duration, calories burned, distance, latitude, longitude, heart rate zones, heartbeat, pace, and speed.
Above, I've graphed my heart rate along with the map of last Saturday's run using GPS coordinates. The hearts (<3) represent my heart rate, which I thought was a really creative way of using the mlab option in the -scatter- command. Who says you're limited to circles, diamonds, squares or triangles in Stata? I made the heart symbols by using a variable I set to "<3". The mlab option also helped me make the "Start" and "End" markers in the map plot. In the next week or so, I plan on using Fitbit's API to make more use of my personal data. Stay tuned :) If you'd like to try this out, copy and paste this into your do-file editor. Make sure to change the global name of the file (fname) to the name of your html file and make sure you're in that directory when running this .do file. As always, feel free to reach out if you have any questions, suggestions, or comments!
/*Author: Belen Chavez*/
/* Description: Parse .HTML code of GPS activity from Fitbit.com to bring into
Stata and create graphs */
clear all
version 12.1
global fname "runactivity2.html"
tempfile f1
/*************** Remove double quotes and some html formatting ****************/
filefilter $fname `f1', f("\Q") t("")
tokenize </span> </td> </tr> <tr> > td class=line-number ///
<td class=line-content> <span class=html-tag> ///
<span class=html-attribute-value> class=html-attribute-name> ///
< <br> -07:00
local i = 1
local j = 2
tempfile f2 f30 f31 f32 f33 f34 f35
while "`1'" != ""{
filefilter `f`i'' `f`j'', f("`1'") t("") replace
mac shift
local ++i
local ++j
tempfile f`j'
}
filefilter `f`i'' `f`j'', f("<<") t("<")
filefilter `f`j'' `f31', f(",{date") t("\n{date")
filefilter `f31' `f32', f("}]") t("}\n")
filefilter `f32' `f33', f("},{") t("}\n{")
filefilter `f33' `f34', f(\n\n) t(\n) replace
filefilter `f34' `f35', f(",{paused") t("\n{paused")
replace v1 = itrim(v1)
replace v1 = subinstr(v1,"<<","<",.)
keep if regexm(v1,"{date:")
/* Drop empty variables*/
replace v1 = subinstr(v1,"trackpoints: [","",.)
qui desc
forv i = 1/`r(k)'{
cap assert v`i'==""
if _rc==0{
drop v`i'
}
}
/* Rename variables */
compress
forv j = 1/15{
replace v`j' = subinstr(v`j',"{","",.)
local nname "`=substr(v`j'[1],1,strpos(v`j'[1],":")-1)'"
di "`nname'"
replace v`j' = subinstr(v`j', "`nname':","",.)
ren v`j' `=proper("`nname'")'
destring `=proper("`nname'")', ignore("{""null" ) replace
}
gen Heartzone = real(substr(v23,-1,1))+1 if regexm(v23,"BELOW")!=1
replace Heartzone = 1 if regexm(v23,"BELOW")==1
move Heartzone Heartrate
/* Drop unnecessary variables */
qui desc
local vr = `r(k)'-1
drop v16 - v`vr'
/* Format time variable */
replace Date = subinstr(Date,"`=substr(Date,-6,6)'","",.)
replace Date = subinstr(Date,"T"," ",.)
gen time = Clock(Date,"YMD hms")
format time %tC
move time Date
drop Date
replace Dur = Dur/60/1000
* Replace missing Heartzone values:
ren Heartrate Heartbeat
forv j = 1/4{
cap qui summ Heartbeat if Heartzone==`j'
cap replace Heartzone = `j' if Heartzone ==. & Heartbeat>=`r(min)' & Heartbeat<=`r(max)'
}
* Label variables
la def m 1 "No-Zone" 2 "Fat Burn" 3 "Cardio" 4 "Peak", replace
la val Heartzone m
la var Heartbeat "Beats per Minute"
la var Heartzone "Heart Rate Zone"
la var Cal "Calories Burned"
la var Speed "Miles per Hour"
la var Pace "Seconds per Mile"
la var Elev "Feet"
la var Dis "Miles"
la var Dur "Minutes"
la var Lat "Latitude"
la var Long "Longitude"
la var Steps "Steps"
gen lab = "<3"
gen tick = "Start" in 1
replace tick = "End" in l
gen every_10 = 1 if mod(_n,10)==1
summ Dis
local Dis: di %4.2fc `r(max)'
di `Dis'
summ Dur
local tim: di %2.0fc `r(max)'
di `tim'
summ time
local da: di %tdDay_Mon_dd,_CCYY dofc(`r(min)')
twoway (scatter Heartbeat Dur if every_10==1 ,ylab(80(20)200) ///
mlab(lab) msymb(none) mlabcolor(red) mlabangle(vertical) ///
mlabpos(12)) , ///
tit("Beats per minute during run") name(minutes, replace)
scatter Lat Long, mlab(tick) msymb(smcircle) tit("Map of run") ///
lpattern(dash) mcolor(blue) ///
xlab(none) ylab(none) name(maps, replace)
graph combine minutes maps, ///
title(Fitbit Parsed Data) subtitle("For Run on `da'") ///
note("Summary: Total Time= `tim' Minutes, Total Distance= `Dis' Miles")
 This graph was made using Stata 12. Data was downloaded from my Fitbit.com dashboard. Recently a few of my coworkers purchased Fitbits and we've been having friendly competitions to see who can get the most steps. I know, it kind of sounds lame, but not surprisingly, I've found that I'm exceeding my steps goal on a daily basis since they bought theirs. Here's a snapshot of my Fitbit App's average steps taken on a monthly basis.
January and February were months where I was super motivated to meet my step goal, which was probably driven by my New Year resolutions and by the "new Fitbit" effect (whereby one wants to meet daily step goals to justify the Fitbit purchase). I was also unemployed in those two months and had more time to walk/run/play. In March, I started a new full-time job and became more sedentary. July is where my steps start to go up again which I like to attribute to competition. I'm generally a competitive person, so this makes sense. Plus, no one likes to lose, right? A little background: I have had a Fitbit Charge HR since January of 2015 and I've been playing with my steps data, heart rate data, and sleep data thanks to their phone app and website. I'm waiting to have enough data to tell me if the the steps I take influences my sleep quality, to see how my resting heart rate fluctuates over time, to see how different fitness instructors help me burn calories, and other such Fitbit/health topics. 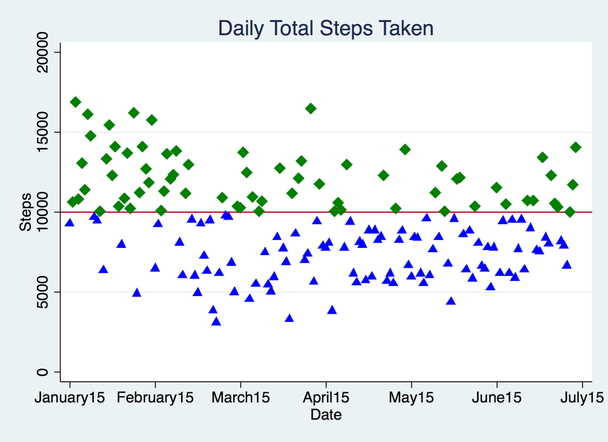 This graph was made using Stata 12. Data was downloaded from my Fitbit.com dashboard. |