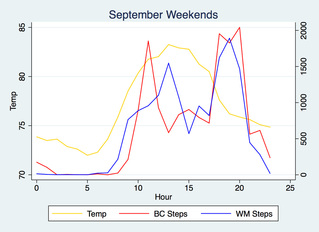
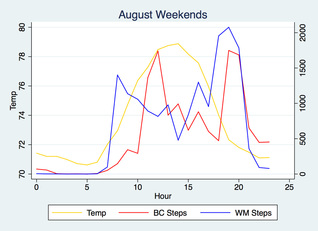
You know how when you have nothing in particular to talk about, you start talking about the weather? Well, let's talk about the weather. September was a really hot month. Well, at least in San Diego. The average temperature recorded at Miramar (KNKX) was 76.3 with a minimum of 66 and a maximum of 94. Compare this to a mean of 73.7, a minimum of 60 and a maximum of 90 in August. For this blog post I wanted to see how my steps looked like alongside the average hourly weather for September. Above, you'll see the hourly weather (in yellow) compared to my average hourly steps (in red) alongside my coworker Will's hourly steps (in blue). During the weekends in September I was more active as the day progressed and the weather got cooler. I took a few long runs or walks in August and September during Saturday/Sunday mornings which explains the spikes before noon. Overall, however, there was less activity during the hotter parts of the day in September than in August, which is to be expected. Nobody wants to be out running when it's hot and humid. Not a lot of surprising data, but it's nice to visualize it here. 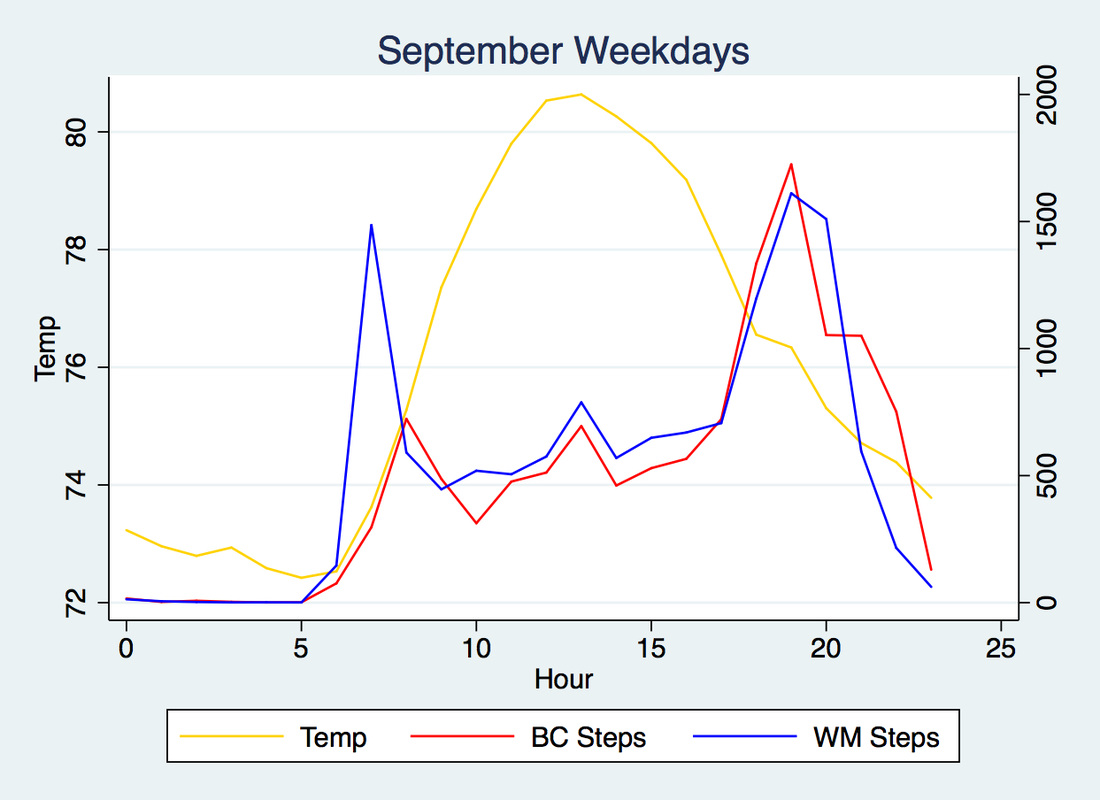 During weekdays, I'm at the office and so there's not a lot of step activity while I'm at work. Recall last month's post regarding my hourly step comparison with my coworker Will. Our steps during the work hours (8 AM - 6 PM) is correlated at 0.93 (our weekend steps were a little correlated at 0.85) in the month of September. A bit higher than last month's 0.89.
I'd be interested to see how correlated my steps are with other people who have a Fitbit at the office, but I have a suspicion it's probably the same as ours. Walks happen during the earlier part of the day, during lunch time, and then going back to the car after work. Thankfully, I didn't suffer too much during last month's heat wave as I was at the office during those hours. Stay tuned for next month's monthly comparison. My plan is to see how Fitbit challenges, like the Weekend Warrior, look on an hourly basis. I hypothesize there are many lags as competitors are driven to beat each other's steps.
0 Comments
Your comment will be posted after it is approved.
Leave a Reply. |