|
I recently got back into Brazilian Jiu Jitsu (BJJ) after being out of training for a year and a half. To be honest, I don't know if I should even count the training I did in 2014, as I only trained for about 3 to 5 months and stopped due to commuting and work. My better half has been training BJJ for a while now and we go watch IBJJF competitions (IBJJF: International Brazilian Jiu Jitsu Federation), such as the World's Championship or the Pan-American Championship whenever they are going on in Southern California.
With the rise of female fighters in the UFC such as Ronda Rousey (my personal favorite and my idol), and female grapplers like Mackenzie Dern, I've been more excited to join in on what has traditionally been a male-dominated sport. For this blog post, I decided to look at the share of women competitors at the Pan-Ams (which in the past few years has been the biggest BJJ tournament in the planet) over time. The data shows that women have been making up a greater share of competitors in the last few years. In 2012, about 24% of white belts were women, and this past year 37% of white belts competitors were women. For almost every belt level, the share of women competing went up. Brown belts declined from 2014 to 2015. Overall, women competitors went from making up 15% of competitors in 2012 to 22% in 2015. I'm excited to see that women are making up greater shares of competitors. I plan on scraping more data from the IBJJF website to get a bigger picture of competitors for all tournaments and will update with new numbers if the data exists.
This data was parsed from registrations for the Pan Jiu Jitsu Championship from ibjjf.com using Stata.
2013 Data is missing. Graph was made with Google Charts API. Analysis is for adult women and men only (excludes juvenile, master, or senior competitors).
1 Comment
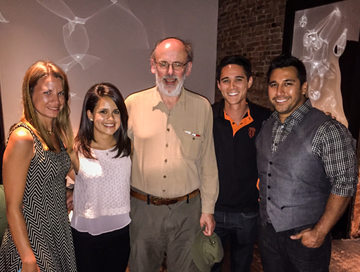
In late July, I got to attend Stata's conference in Columbus, Ohio. It was my first Stata Conference and I went as part of my professional development through my employer. Three of my coworkers also went to the conference and we got to meet fellow Stata users, Stata programmers, Stata employees, and best of all: Bill Gould & Nick Cox!
Day 1: My very first interaction while checking in to the conference was having Stata's Twitter and social media manager recognize that I tweet a lot about Stata. My day was off to a great start! I liked all the different presentations on various different fields and got to learn about Stata commands that I didn't even know existed. At the end of day 1, there was a dinner that most conference attendees went to, and we, for some reason, did not purchase dinner tickets. Big mistake. However, thanks to Stata's awesome hosts we got invited to partake on the dinner fun and it was the best decision ever. We got to sit at the table with Bill Gould, Richard Williams (he has a great website), and Phil Ender (a former consultant at UCLA.) We also got to mingle with friendly Stata employees like Chris and Gretchen, who were the ones making sure the conference was going smoothly and who graciously invited us to dinner. Our networking with Phil was such a success that we were able to get a great seminar on missing data in San Diego last month. Day 2: A continuation of very informative presentations. For example, did you know that there are a bunch of different color schemes available for charts and graphs (brewscheme)? Or did you know that you can use -display- to save locals? You can see an example of that on my post regarding parsing fitbit data: local da: di %tdDay_Mon_dd,_CCYY dofc(r(min))
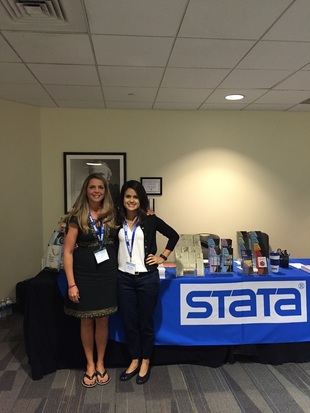
Overall a great experience! I highly recommend it. Not only did I learn a lot, but I also had a lot of fun. One of my favorite memories was discussing Stata's untapped market of Stata themed bed linens & pillow-cases with Nick Cox and my coworkers. This idea came up after asking Gretchen if they sold the Stata tablecloth (pictured below) in the Stata gift shop. They don't. We all said it would be nice to hug a Stata pillow at night (nerds, but hey I love it!)
I took the picture below while departing Chicago en route to Columbus, little did I know that this is where #Stata2016 will be held. Until next year, Stata Conference!

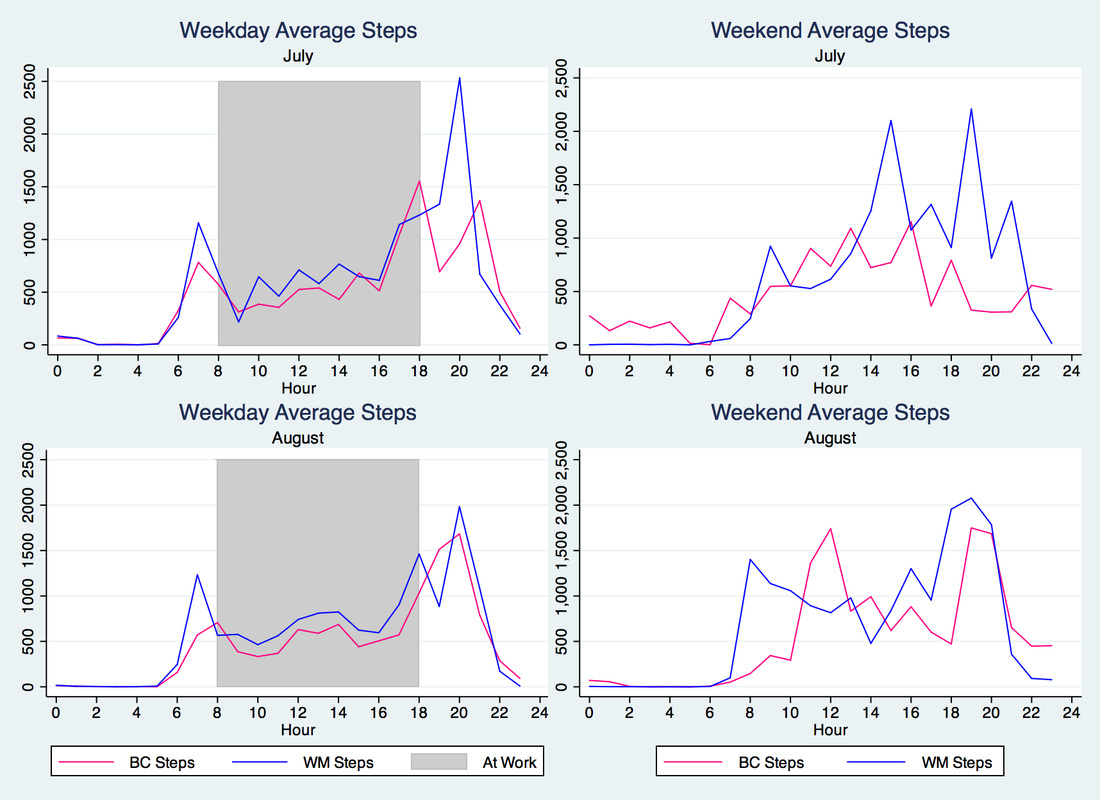 A fellow coworker of mine gave me his hourly Fitbit steps data to analyze in combination with my data to see if there are any similarities or patterns that emerge. Above, I've summarized the average steps taken hourly for both of us by weekday or weekend for the months of July and August. Note: He purchased his Fitbit in July, so there are a few days that are missing, but he more than made up for that by logging crazy amounts of steps (he got to 25,000 steps in one day -- a Fitbit "badge" I've yet to earn!). So, what does this data tell us? During weekdays of July and August:
So why did I do this? Well, at work, the both of us constantly check our Fitbits and compare whose got the most steps. It kind of drives everyone who doesn't have a Fitbit a little insane (and maybe even those who have Fitbits, but aren't obsessed). Friendly, and better yet, healthy rivalries never hurt anybody, right? For more details, I've included a snapshot below of the last full week of August. You can see we have very similar weekdays and sometimes I'm even winning in terms of step count :) 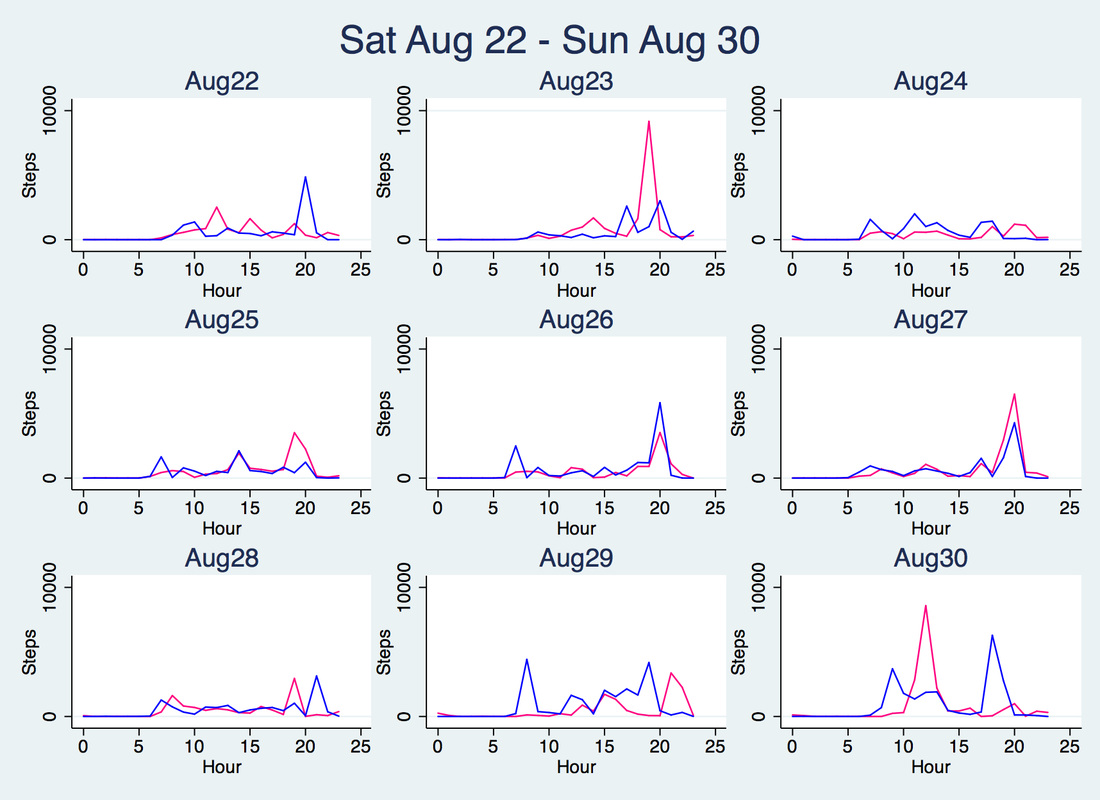 Hoping that my September step count looks a lot better than WM's or my previous month's step count, for that matter. It better be! I just signed up for my first half marathon!
Thanks to my Fitbit Charge HR, I have been tracking my activities, such as running, walking, and Barre3. Logged activities on Fitbit include a summary of calories burned, minutes spent in different heart rate zones, total time of activity, and steps taken. I wanted to see if different instructors were having a different effect on my workouts since I sometimes left a hot mess and other times not so much after leaving Barre3. So, I started tracking activities and have a total of 94 classes in a sample that I've analyzed to figure out which instructors pushed me the most. Below, I’ve plotted the average number of minutes spent in each heart rate zone from fat burn, cardio, to peak zone along with my instructors .
Not only did this visualization help me figure out which instructors were pushing me the most it also helped me realize that I was spending less than 15 minutes in the cardio zone (on average) doing the online workouts! I guess the class atmosphere is more effective (plus, sometimes Hayek would interrupt my workouts - he really likes my yoga mat). As you can see, Jenn, Kate and Lauren helped me spend more time in the peak heart rate zone, so their classes were the ones I liked to attend the most. I originally made a dashboard on Tableau by downloading my activity data on Fitbit, cleaning up the data using Stata, saving it as a .CSV file and then playing with different visualizations on Tableau Public. I originally also posted the Tableau chart here, however, when displaying it on my blog it didn't seem to be mobile friendly so I used Google Charts API instead. It ended up being a win-win: I learned something new and now mobile readers will have an easier time scrolling through the chart. A little bit about myself: I grew up strictly speaking Spanish at home up until pre-school where I started learning English. Barney and Friends as well as Lamb Chop's Play Along were my favorite shows to supplement my learning. When I was in Kindergarten, my parents asked my teacher, Ms. Kassel, if the bilingual class would be better for me since I was still learning English, but she told them that I was learning quickly and that I'd be fluent in no time. Thanks to her and maybe a placement test (I don't remember if a test was required back then), I was not placed in an English Learning program and continued on as any new Kindergartner in the public school system in California.
Fast-forward to two decades later where I was being interviewed by Laura Hill, Ph.D, for a Research Associate Position at PPIC regarding a project on outcomes of English Learners. I was super interested, so of course I took the job. First of all, how often do you get an opportunity to do research on topics which have a direct relation to you and your life? Second of all, I wanted to learn about policy work in relation to applied economics; and, last but not least, San Francisco is a pretty neat city. So I joined in 2013 and we worked on this project through last May (2014). In that project I got to look at longitudinal student data on grades, demographics, parental information, and state test scores. We created cohorts and looked at how different criteria for reclassification and the timing of reclassification predicted on-time grade progression and high school graduation. For people who aren't familiar with what reclassification is, it's the move from English Learning programs to general education. Ultimately, that study found that the earlier a student is reclassified, the more success they have throughout middle school and high school. This wasn't a very surprising finding, but it was surprising to see that sometimes those English Learners fared better on state tests and/or had better grades than native English speakers. For more details on that work and if you want to check out some charts and graphs made by yours truly, you can find that study here. This project has been the only project that has hit so close to home and it was really fascinating looking at the data. It was also a trip down memory lane as I recalled my progress throughout K-12 and those pesky test forms we filled out on the first page or so of California state tests for English/Reading/Math etc. (I remember always wondering who would end up looking at that information). For example, do you remember filling out your parents' highest level of education on those? I do. I totally lied on them. One year I said my parents both had Master's degree, on another I said they only had "some college" and eventually I was honest and said they didn't finish high school. I bring this up, because another interesting finding was that we found some inconsistencies in the data regarding this variable, and I remember telling my research team about that. Really, though, can you really trust a 1st-4th grader to know whether or not their parent graduated high school, completed some college, graduated college, or went to graduate school? Plus, what if you were me and a judgmental desk neighbor was looking over your shoulder? Of course your parents graduated college. In case you're curious, I think we ultimately used the parents' filled out forms to populate that variable. Anyway, that's a little about me personally and professionally. Thank you, again, Ms. Kassel for your sound advice to my parents :) |