|
Thanks to my Fitbit Charge HR, I have been tracking my activities, such as running, walking, and Barre3. Logged activities on Fitbit include a summary of calories burned, minutes spent in different heart rate zones, total time of activity, and steps taken. I wanted to see if different instructors were having a different effect on my workouts since I sometimes left a hot mess and other times not so much after leaving Barre3. So, I started tracking activities and have a total of 94 classes in a sample that I've analyzed to figure out which instructors pushed me the most. Below, I’ve plotted the average number of minutes spent in each heart rate zone from fat burn, cardio, to peak zone along with my instructors .
Not only did this visualization help me figure out which instructors were pushing me the most it also helped me realize that I was spending less than 15 minutes in the cardio zone (on average) doing the online workouts! I guess the class atmosphere is more effective (plus, sometimes Hayek would interrupt my workouts - he really likes my yoga mat). As you can see, Jenn, Kate and Lauren helped me spend more time in the peak heart rate zone, so their classes were the ones I liked to attend the most. I originally made a dashboard on Tableau by downloading my activity data on Fitbit, cleaning up the data using Stata, saving it as a .CSV file and then playing with different visualizations on Tableau Public. I originally also posted the Tableau chart here, however, when displaying it on my blog it didn't seem to be mobile friendly so I used Google Charts API instead. It ended up being a win-win: I learned something new and now mobile readers will have an easier time scrolling through the chart.
0 Comments
A little bit about myself: I grew up strictly speaking Spanish at home up until pre-school where I started learning English. Barney and Friends as well as Lamb Chop's Play Along were my favorite shows to supplement my learning. When I was in Kindergarten, my parents asked my teacher, Ms. Kassel, if the bilingual class would be better for me since I was still learning English, but she told them that I was learning quickly and that I'd be fluent in no time. Thanks to her and maybe a placement test (I don't remember if a test was required back then), I was not placed in an English Learning program and continued on as any new Kindergartner in the public school system in California.
Fast-forward to two decades later where I was being interviewed by Laura Hill, Ph.D, for a Research Associate Position at PPIC regarding a project on outcomes of English Learners. I was super interested, so of course I took the job. First of all, how often do you get an opportunity to do research on topics which have a direct relation to you and your life? Second of all, I wanted to learn about policy work in relation to applied economics; and, last but not least, San Francisco is a pretty neat city. So I joined in 2013 and we worked on this project through last May (2014). In that project I got to look at longitudinal student data on grades, demographics, parental information, and state test scores. We created cohorts and looked at how different criteria for reclassification and the timing of reclassification predicted on-time grade progression and high school graduation. For people who aren't familiar with what reclassification is, it's the move from English Learning programs to general education. Ultimately, that study found that the earlier a student is reclassified, the more success they have throughout middle school and high school. This wasn't a very surprising finding, but it was surprising to see that sometimes those English Learners fared better on state tests and/or had better grades than native English speakers. For more details on that work and if you want to check out some charts and graphs made by yours truly, you can find that study here. This project has been the only project that has hit so close to home and it was really fascinating looking at the data. It was also a trip down memory lane as I recalled my progress throughout K-12 and those pesky test forms we filled out on the first page or so of California state tests for English/Reading/Math etc. (I remember always wondering who would end up looking at that information). For example, do you remember filling out your parents' highest level of education on those? I do. I totally lied on them. One year I said my parents both had Master's degree, on another I said they only had "some college" and eventually I was honest and said they didn't finish high school. I bring this up, because another interesting finding was that we found some inconsistencies in the data regarding this variable, and I remember telling my research team about that. Really, though, can you really trust a 1st-4th grader to know whether or not their parent graduated high school, completed some college, graduated college, or went to graduate school? Plus, what if you were me and a judgmental desk neighbor was looking over your shoulder? Of course your parents graduated college. In case you're curious, I think we ultimately used the parents' filled out forms to populate that variable. Anyway, that's a little about me personally and professionally. Thank you, again, Ms. Kassel for your sound advice to my parents :) 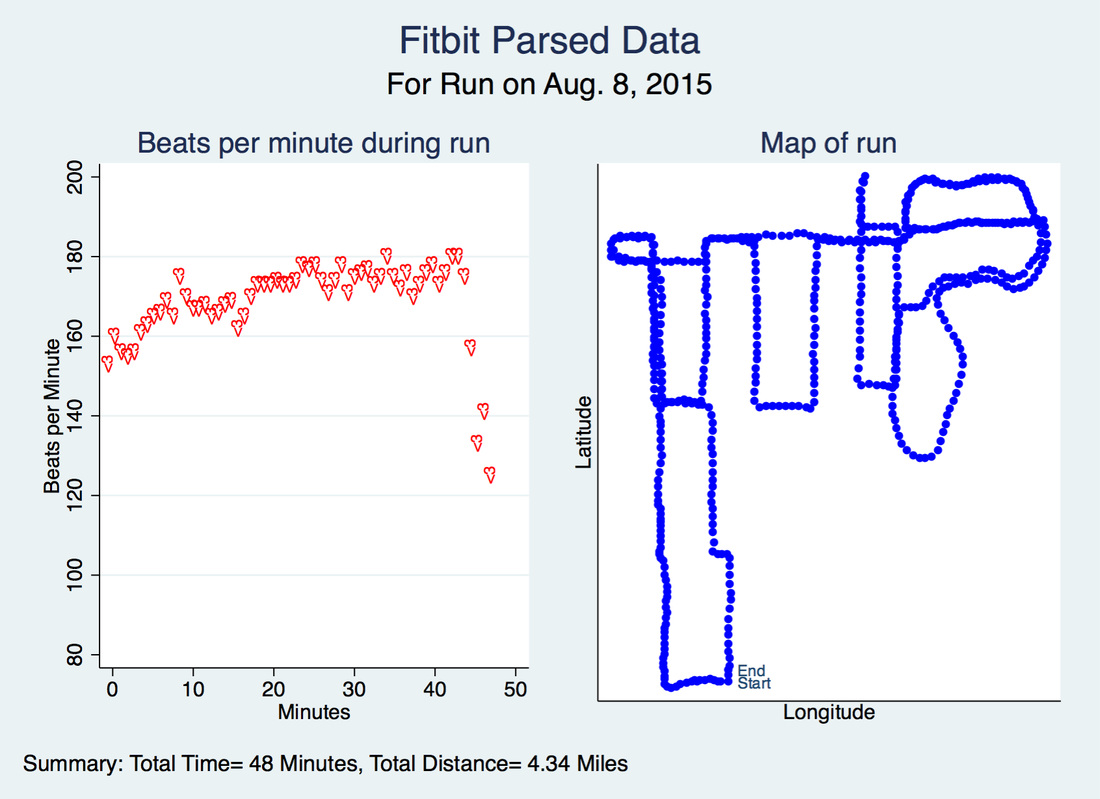
My data is from Fitbit.com. Graphs were made using Stata 12/IC.
Recently, I learned how to parse data on Fitbit.com by going to the Log -> Activities page and looking at individual activities such as walks or runs in Stata. By viewing the page source information and saving it as an .html file, I am able to parse out what data my fitbit collects during an activity such as: duration, calories burned, distance, latitude, longitude, heart rate zones, heartbeat, pace, and speed.
Above, I've graphed my heart rate along with the map of last Saturday's run using GPS coordinates. The hearts (<3) represent my heart rate, which I thought was a really creative way of using the mlab option in the -scatter- command. Who says you're limited to circles, diamonds, squares or triangles in Stata? I made the heart symbols by using a variable I set to "<3". The mlab option also helped me make the "Start" and "End" markers in the map plot. In the next week or so, I plan on using Fitbit's API to make more use of my personal data. Stay tuned :) If you'd like to try this out, copy and paste this into your do-file editor. Make sure to change the global name of the file (fname) to the name of your html file and make sure you're in that directory when running this .do file. As always, feel free to reach out if you have any questions, suggestions, or comments!
/*Author: Belen Chavez*/
/* Description: Parse .HTML code of GPS activity from Fitbit.com to bring into
Stata and create graphs */
clear all
version 12.1
global fname "runactivity2.html"
tempfile f1
/*************** Remove double quotes and some html formatting ****************/
filefilter $fname `f1', f("\Q") t("")
tokenize </span> </td> </tr> <tr> > td class=line-number ///
<td class=line-content> <span class=html-tag> ///
<span class=html-attribute-value> class=html-attribute-name> ///
< <br> -07:00
local i = 1
local j = 2
tempfile f2 f30 f31 f32 f33 f34 f35
while "`1'" != ""{
filefilter `f`i'' `f`j'', f("`1'") t("") replace
mac shift
local ++i
local ++j
tempfile f`j'
}
filefilter `f`i'' `f`j'', f("<<") t("<")
filefilter `f`j'' `f31', f(",{date") t("\n{date")
filefilter `f31' `f32', f("}]") t("}\n")
filefilter `f32' `f33', f("},{") t("}\n{")
filefilter `f33' `f34', f(\n\n) t(\n) replace
filefilter `f34' `f35', f(",{paused") t("\n{paused")
replace v1 = itrim(v1)
replace v1 = subinstr(v1,"<<","<",.)
keep if regexm(v1,"{date:")
/* Drop empty variables*/
replace v1 = subinstr(v1,"trackpoints: [","",.)
qui desc
forv i = 1/`r(k)'{
cap assert v`i'==""
if _rc==0{
drop v`i'
}
}
/* Rename variables */
compress
forv j = 1/15{
replace v`j' = subinstr(v`j',"{","",.)
local nname "`=substr(v`j'[1],1,strpos(v`j'[1],":")-1)'"
di "`nname'"
replace v`j' = subinstr(v`j', "`nname':","",.)
ren v`j' `=proper("`nname'")'
destring `=proper("`nname'")', ignore("{""null" ) replace
}
gen Heartzone = real(substr(v23,-1,1))+1 if regexm(v23,"BELOW")!=1
replace Heartzone = 1 if regexm(v23,"BELOW")==1
move Heartzone Heartrate
/* Drop unnecessary variables */
qui desc
local vr = `r(k)'-1
drop v16 - v`vr'
/* Format time variable */
replace Date = subinstr(Date,"`=substr(Date,-6,6)'","",.)
replace Date = subinstr(Date,"T"," ",.)
gen time = Clock(Date,"YMD hms")
format time %tC
move time Date
drop Date
replace Dur = Dur/60/1000
* Replace missing Heartzone values:
ren Heartrate Heartbeat
forv j = 1/4{
cap qui summ Heartbeat if Heartzone==`j'
cap replace Heartzone = `j' if Heartzone ==. & Heartbeat>=`r(min)' & Heartbeat<=`r(max)'
}
* Label variables
la def m 1 "No-Zone" 2 "Fat Burn" 3 "Cardio" 4 "Peak", replace
la val Heartzone m
la var Heartbeat "Beats per Minute"
la var Heartzone "Heart Rate Zone"
la var Cal "Calories Burned"
la var Speed "Miles per Hour"
la var Pace "Seconds per Mile"
la var Elev "Feet"
la var Dis "Miles"
la var Dur "Minutes"
la var Lat "Latitude"
la var Long "Longitude"
la var Steps "Steps"
gen lab = "<3"
gen tick = "Start" in 1
replace tick = "End" in l
gen every_10 = 1 if mod(_n,10)==1
summ Dis
local Dis: di %4.2fc `r(max)'
di `Dis'
summ Dur
local tim: di %2.0fc `r(max)'
di `tim'
summ time
local da: di %tdDay_Mon_dd,_CCYY dofc(`r(min)')
twoway (scatter Heartbeat Dur if every_10==1 ,ylab(80(20)200) ///
mlab(lab) msymb(none) mlabcolor(red) mlabangle(vertical) ///
mlabpos(12)) , ///
tit("Beats per minute during run") name(minutes, replace)
scatter Lat Long, mlab(tick) msymb(smcircle) tit("Map of run") ///
lpattern(dash) mcolor(blue) ///
xlab(none) ylab(none) name(maps, replace)
graph combine minutes maps, ///
title(Fitbit Parsed Data) subtitle("For Run on `da'") ///
note("Summary: Total Time= `tim' Minutes, Total Distance= `Dis' Miles")
It's crazy knowing how much data we put out there ourselves as consumers of social media. Take LinkedIn, for example. You may think you're only posting your skills, current/previous job titles held, and connecting with people, but you're also giving that information away for anyone to see and scrutinize. I'm not just talking about strangers -- e.g. future co-workers, old classmates, people you met once -- I'm talking about anybody you've let into your network.
Today, for example, I went through two profiles, for person X and person Y, and noticed just how much data I can analyze and what I can deduce from such data. Person X: Person X is a contact in my network. First thing I notice are overstatements abound. Person X used VBA once and listed VBA as a skill (does anybody else do this? Or am I the only one who thinks it's slightly deceiving?). This person looks at some large data (10k rows, maybe), but calls it "Big Data". This person also has 3-4 pretty lengthy bullet points regarding new job but, that position was started not even 3 months ago. Many of these bullet points are of underway projects that seem like they've been completed and some of these bullet points are pure hyperboles. I could conclude the following: this person is on the job market again and is marketing him/herself for another job. (Another conclusion could be made, but I noticed that this person has consistently ranked in the top 1% for profile views, which I'm assuming are of interested recruiters). Person Y: This person is a 3rd degree connection in my network. I can gather the following details from this person's profile. Current and previous jobs along with a timeline for when those positions were held. I can also see this person's education and degree information. Person Y piques my interest because this person is working in a position for which their qualifications don't quite match the job description --think MPA working as a private banker. Something doesn't quite add up. Looking over their profile didn't help the confusion, but just as you might be, I was curious. These are only two tiny examples. There is everybody else who uses LinkedIn. You can estimate people's age (or range) if that they have posted graduation dates on their profiles (creepy!). At the end of the day, you can (or at least, try to) tell a story with someone's information. Take me, for example, I've had interview questions regarding my movement from UC Irvine to Florida for work, then Duke for graduate school, San Francisco for public policy work, and finally San Diego. I can only guess that others who don't know me might wonder the same thing. LinkedIn is only one of social media website for which data is available for people to check out through posted profiles. Personal public (and even private) profiles on LinkedIn, Facebook, Instagram, and others social media website are up for anyone to see, analyze, and judge. Just think somebody, somewhere could be looking at your data on your profile right now. You never know!  This graph was made using Stata 12. Data was downloaded from my Fitbit.com dashboard. Recently a few of my coworkers purchased Fitbits and we've been having friendly competitions to see who can get the most steps. I know, it kind of sounds lame, but not surprisingly, I've found that I'm exceeding my steps goal on a daily basis since they bought theirs. Here's a snapshot of my Fitbit App's average steps taken on a monthly basis.
January and February were months where I was super motivated to meet my step goal, which was probably driven by my New Year resolutions and by the "new Fitbit" effect (whereby one wants to meet daily step goals to justify the Fitbit purchase). I was also unemployed in those two months and had more time to walk/run/play. In March, I started a new full-time job and became more sedentary. July is where my steps start to go up again which I like to attribute to competition. I'm generally a competitive person, so this makes sense. Plus, no one likes to lose, right? A little background: I have had a Fitbit Charge HR since January of 2015 and I've been playing with my steps data, heart rate data, and sleep data thanks to their phone app and website. I'm waiting to have enough data to tell me if the the steps I take influences my sleep quality, to see how my resting heart rate fluctuates over time, to see how different fitness instructors help me burn calories, and other such Fitbit/health topics. 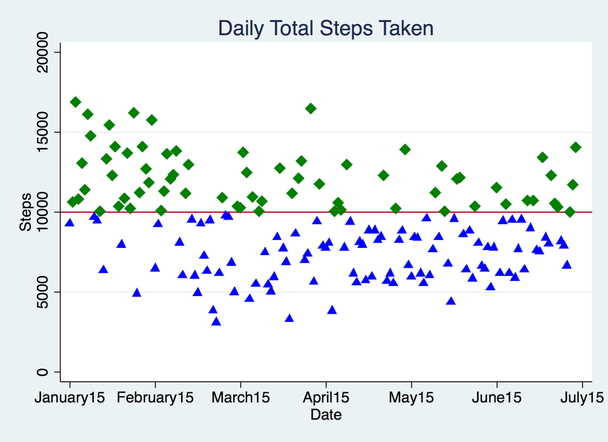 This graph was made using Stata 12. Data was downloaded from my Fitbit.com dashboard. |
